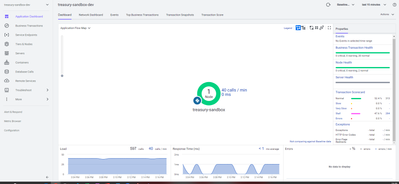
Unable to drill down the End-End Latency Time (ms) in Business Transaction Snapshots in Appdynamics
We are trying to see why my application is taking too much as end-end latency time in business transaction snapshots shows a high value. We are unable to drill down the latency time when viewed details into it ? Is there a way where we can see the f...


