- Community Hub
- Forum Q&A
- Business iQ (Analytics)
- Controller (SaaS, On Premise)
- Dashboards
- Dynamic Languages (Node.JS, Python, PHP, C/C++, Webserver Agent)
- End User Monitoring (EUM)
- Infrastructure (Server, Network, Database)
- Java (Java Agent, Installation, JVM, and Controller Installation)
- Licensing (including Trial)
- .NET (Agent, Installation)
- Privacy and Security
- Smart Agent
- General Discussions
- Resources
- Groups
- Idea Exchange
Not a customer? Click the 'Start a free trial' link to begin a 30-day SaaS trial of our product and to join our community.
Existing Cisco AppDynamics customers should click the 'Sign In' button to authenticate to access the community
- Cisco AppDynamics Community
- Forums Q&A
- Controller
- Re: Violation details in Health rule
- Subscribe to RSS Feed
- Mark Topic as New
- Mark Topic as Read
- Float this Topic for Current User
- Bookmark
- Subscribe
- Mute
- Printer Friendly Page
- Mark as New
- Bookmark
- Subscribe
- Mute
- Subscribe to RSS Feed
- Permalink
- Report Inappropriate Content
05-29-2018 04:15 AM
Hi,
I've configured alert for an application to get details about no of slow calls for last 60 minutes time range.
I'm getting alerts triggered when threshold breaches the configured baseline, im getting no of calls which went slow for that time frame. But i'm unable to drilldown which call or transactions went slow for that time.
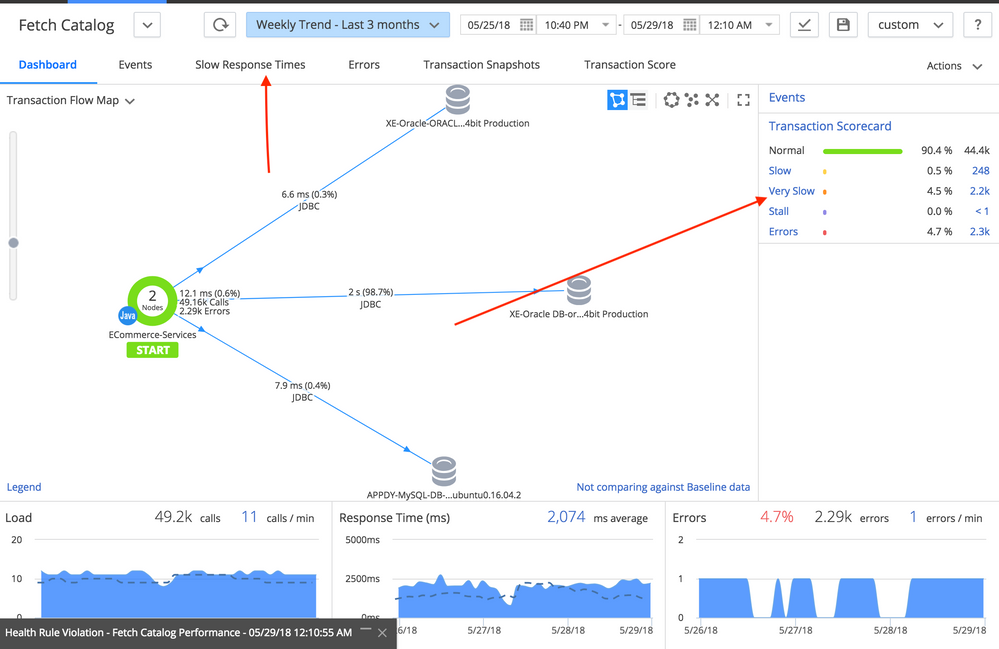
When i click option "view dashboard during Healthrule violation", it takes me to Tier & node dashboard.
Is it possible to identify which call went slow.
Regards,
Soundarajan
Solved! Go to Solution.
- Mark as New
- Bookmark
- Subscribe
- Mute
- Subscribe to RSS Feed
- Permalink
- Report Inappropriate Content
05-29-2018 09:29 PM
Hi Soundarajan,
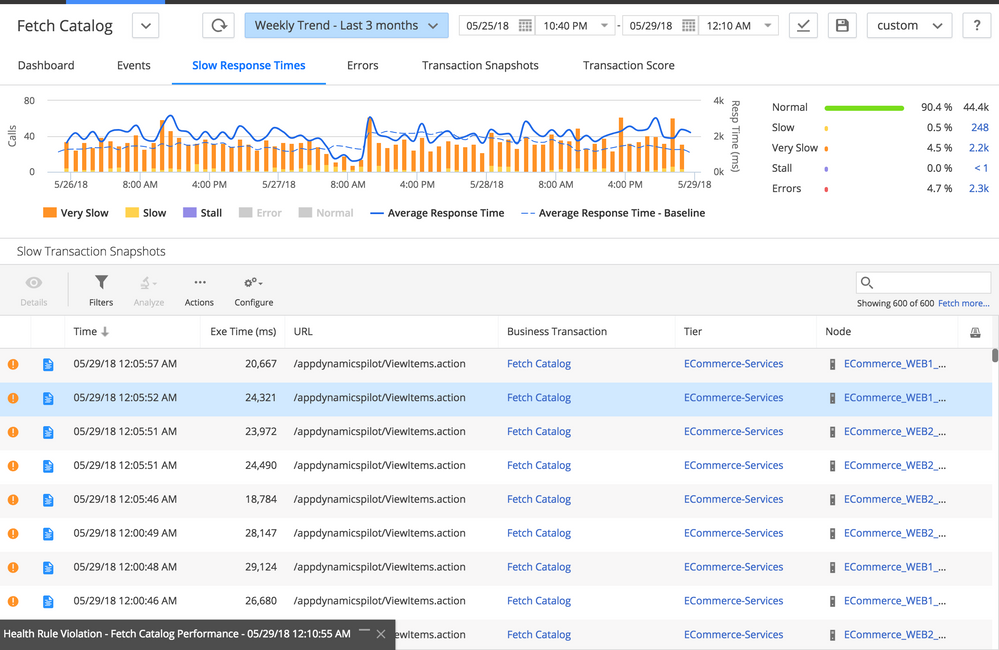
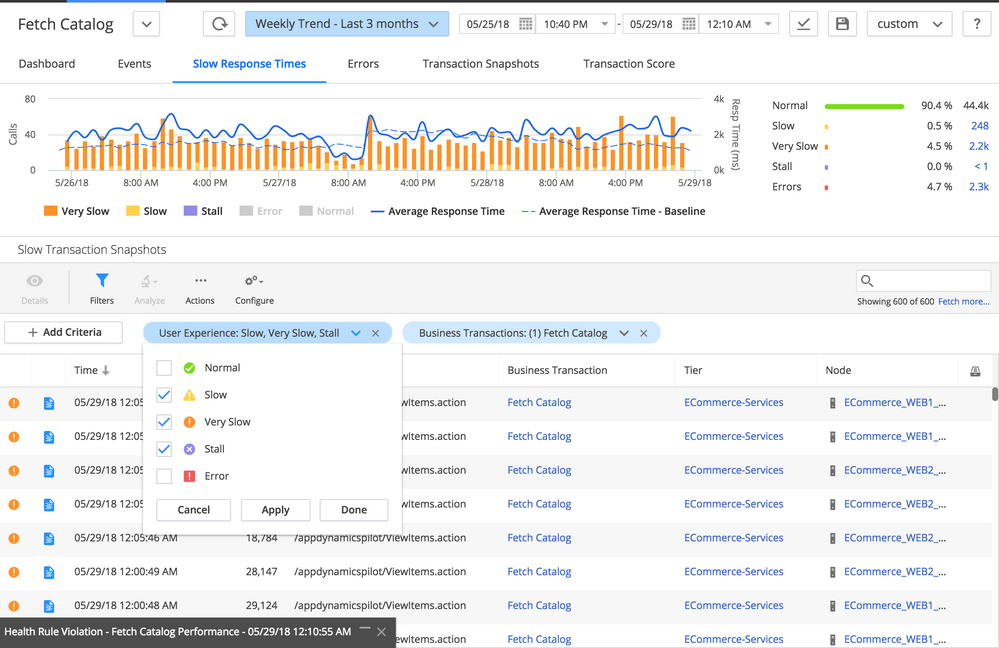
When you click option "view dashboard during Healthrule violation", and move to the Tier & node dashboard. You can move to "Slow Response time" tab and also can the snapshots filter on the type of call for that time range.
-Thanks
- Mark as New
- Bookmark
- Subscribe
- Mute
- Subscribe to RSS Feed
- Permalink
- Report Inappropriate Content
06-25-2018 10:37 PM
Thanks for your Solution Pratik !!
Learn how Splunk and AppDynamics are redefining observability
Register Now!
Dive into our Community Blog for the Latest Insights and Updates!
Read the blog here
- AppDynamics Health Rule Violation Alerts Not Triggered for All Nodes in Slack in General Discussions
- Health Rule - Wait time after violation in Controller (SaaS, On Premises)
- Url of effected metric in metric browser in DB alerts (email and http) in Infrastructure (Server, Network, Database)
- Health Rules violations report in General Discussions
- Custom Dashboard and report in Excel Format in Dashboards
| User | Count |
|---|---|
| 1 | |
| 1 | |
| 1 | |
| 1 |

Thank you! Your submission has been received!
Thank you! Your submission has been received!
Oops! Something went wrong while submitting the form


