- Community Hub
- Forum Q&A
- Business iQ (Analytics)
- Cisco Cloud Observability
- Controller (SaaS, On Premise)
- Dashboards
- Dynamic Languages (Node.JS, Python, PHP, C/C++, Webserver Agent)
- End User Monitoring (EUM)
- Infrastructure (Server, Network, Database)
- Java (Java Agent, Installation, JVM, and Controller Installation)
- Licensing (including Trial)
- .NET (Agent, Installation)
- Privacy and Security
- Smart Agent
- General Discussions
- Resources
- Groups
- Idea Exchange
Not a customer? Click the 'Start a free trial' link to begin a 30-day SaaS trial of our product and to join our community.
Existing Cisco AppDynamics customers should click the 'Sign In' button to authenticate to access the community
- Cisco AppDynamics Community
- Forums Q&A
- Dashboards
- Application Health
- Subscribe to RSS Feed
- Mark Topic as New
- Mark Topic as Read
- Float this Topic for Current User
- Bookmark
- Subscribe
- Mute
- Printer Friendly Page
Application Health
- Mark as New
- Bookmark
- Subscribe
- Mute
- Subscribe to RSS Feed
- Permalink
- Report Inappropriate Content
11-16-2022 01:45 AM - last edited on 11-16-2022 01:47 PM by Ryan.Paredez
Hi,
I have an application that is 2 tiers and all tiers are hosted on 2 nodes. We need to monitor the application's uptime and downtime.
If the last 7 days the application is down in one day we need a percentage that says that the application is up 6 days and down 1 day
Is it possible to do this?
^ Post edited by @Ryan.Paredez for formatting
- Mark as New
- Bookmark
- Subscribe
- Mute
- Subscribe to RSS Feed
- Permalink
- Report Inappropriate Content
04-02-2023 10:57 AM - edited 04-02-2023 11:08 AM
Hi @Salah.Tarek Khattab ,
Here is an example which I use to calculate application health for my use-case. You can define the timeline and formula based on your business need.
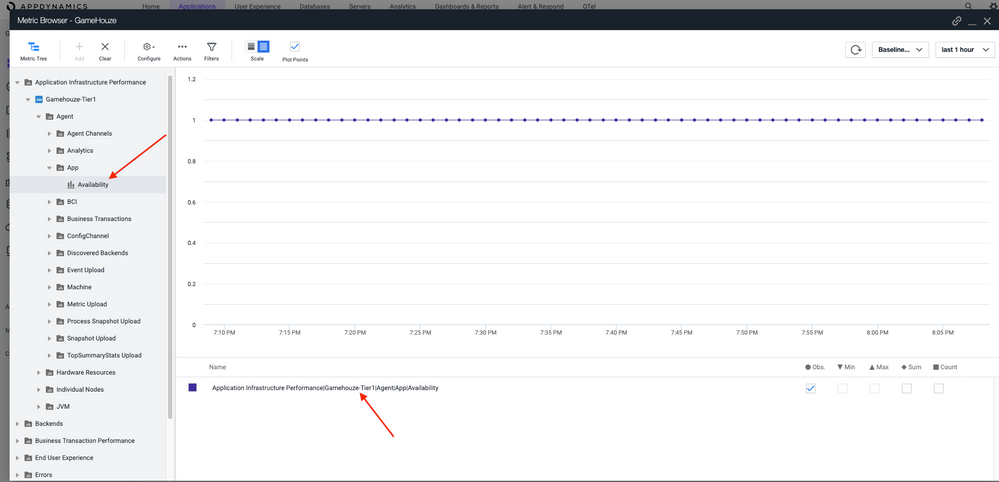
- To see app availability, you can create different widgets for different time ranges. You can refer to the App Agent Availability metric which is a derived metric(Under metric browser--> Application Infrastructure Performance|Tier|Individual Node|Agent|App|Availability)
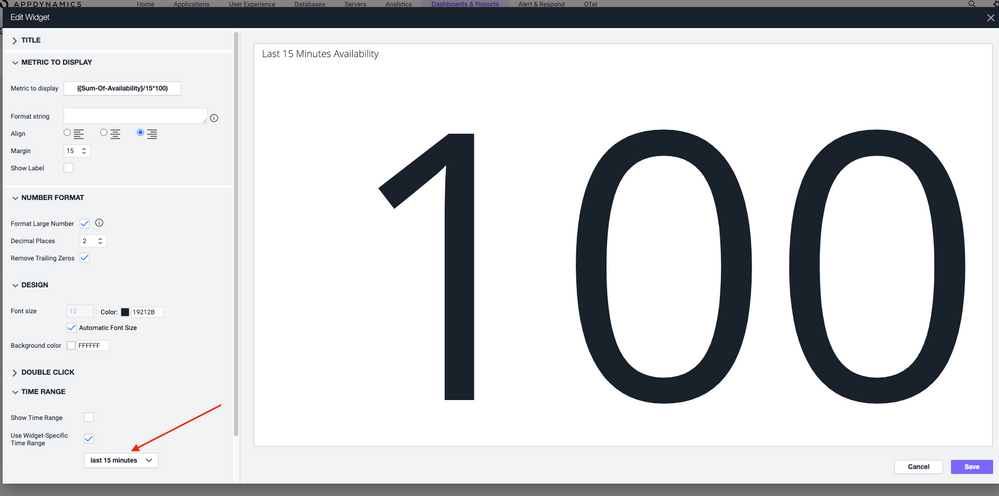
- When creating this widget, please select widget-specific time range. For different widgets showing availability data of different time-ranges, select respective time-range.
- We can give you example but you have to determine what metrics are important to you and what formula makes more sense to you.
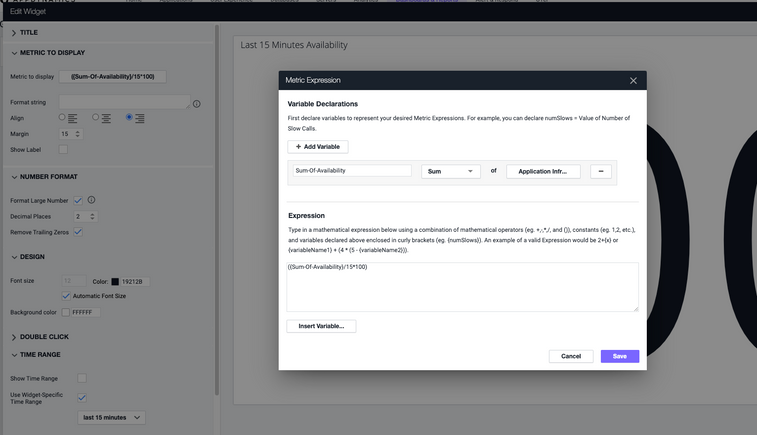
- In the metric expression, you can use the same metric (APP|AGENT|AVAILABILITY) of type SUM and divide this value by the time (in minutes).
- The availability metric sends out metric every minute. So if you want availability % for last 15 mins and if you get 10 metric points, then the agent was up for 10/15 ~ 66.66%.
The metric expression I have used is:({Sum-Of-Availability} / time_in_minutes) * 100 -
Where variable :
Sum-Of-Availability = Sum of (Agent | App | Availability)
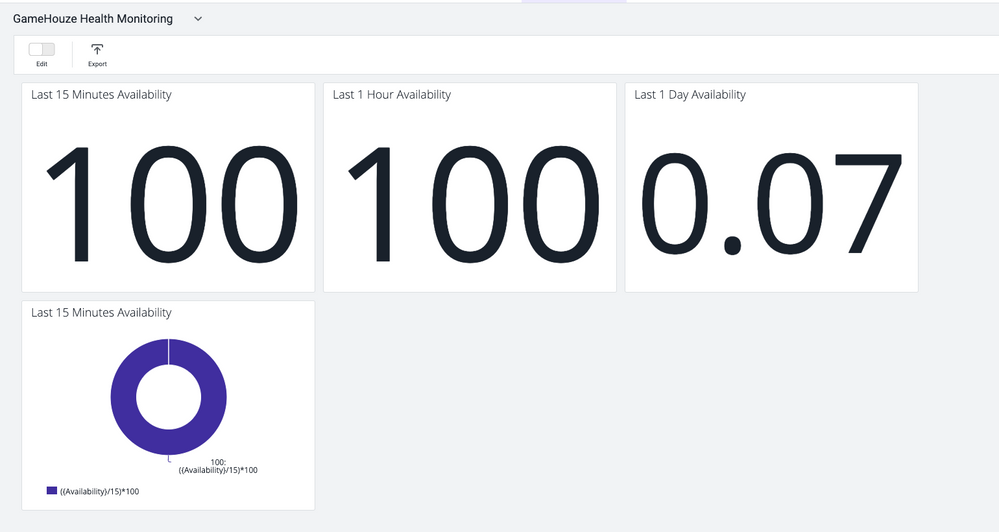
- You can create different widgets for different time-range. As shown in the screenshot below, I have created 3 widgets in my "GameHouse Availability Monitoring" Dashboard where each widget shows availability value for different time-range.
- The AppDynamics agent does report application availability metrics. It will only report when the App Agent process is up and running. Even if there are no traffic on application, agent will report CLR metrics and agent availability will be >0. If application gets terminated gracefully, the app agent will also go down and stop reporting until the next request hits the server.
You can use the metric expression to calculate the average/percentage. Please go through the below documents: https://docs.appdynamics.com/appd/22.x/latest/en/appdynamics-essentials/dashboards-and-reports/custo...
Please check "Metric Expression" section in link below. You can use the instructions to create metric expressions: https://docs.appdynamics.com/display/PRO21/Create+a+Health+Rule+and+Fine-tune+Metric+Evaluation
Please let me know if adding a Widget as shown in screenshots helps you.
Discover new Splunk integrations and AI innovations for Cisco AppDynamics.
Register Now!
Dive into our Community Blog for the Latest Insights and Updates!
Read the blog here
- AppD Java Agent for Web Apps - ClaasNotFound Error in Java (Java Agent, Installation, JVM, and Controller Installation)
- Unable to query the No.of calls of a business transaction in Controller (SaaS, On Premises)
- Licenses is not released in Licensing (including Trial)
- Node.js agent won't capture call graph with auto instrumentation in Dynamic Languages (Node.JS, Python, PHP, C/C++, Webserver Agent)
- My problem with baselines and moving averages ingesting bad data in General Discussions
| User | Count |
|---|---|
| 1 | |
| 1 | |
| 1 | |
| 1 | |
| 1 |

Thank you! Your submission has been received!
Thank you! Your submission has been received!
Oops! Something went wrong while submitting the form


