- Community Hub
- Forum Q&A
- Business iQ (Analytics)
- Cisco Cloud Observability
- Controller (SaaS, On Premise)
- Dashboards
- Dynamic Languages (Node.JS, Python, PHP, C/C++, Webserver Agent)
- End User Monitoring (EUM)
- Infrastructure (Server, Network, Database)
- Java (Java Agent, Installation, JVM, and Controller Installation)
- Licensing (including Trial)
- .NET (Agent, Installation)
- Privacy and Security
- Smart Agent
- General Discussions
- Resources
- Groups
- Idea Exchange
Not a customer? Click the 'Start a free trial' link to begin a 30-day SaaS trial of our product and to join our community.
Existing Cisco AppDynamics customers should click the 'Sign In' button to authenticate to access the community
- Cisco AppDynamics Community
- Resources
- Knowledge Base
- How do I resolve common issues with Business iQ?
- Subscribe to RSS Feed
- Mark as New
- Mark as Read
- Bookmark
- Subscribe
- Printer Friendly Page
- Report Inappropriate Content
- Article History
- Subscribe to RSS Feed
- Mark as New
- Mark as Read
- Bookmark
- Subscribe
- Printer Friendly Page
- Report Inappropriate Content
on
10-20-2017
10:42 AM
- edited on
11-30-2018
10:17 AM
by
Radhika.Puthiye
Common Issues
Analytics Agent Is Not Sending Data
Permissions Errors / Unable to View Data in the UI
Agents Properly Configured but Data Not Showing Up in UI
Transaction Analytics Not All Showing Default Field Data
Log Analytics Data Not Showing Up
Events Service Won't Start
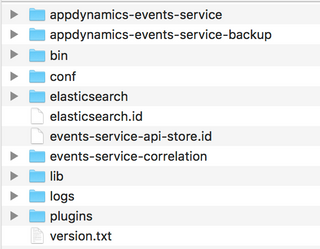
An improper shut down of the Events Service and Elasticsearch processes causes them to leave events-service-api-store.id and elasticsearch.id artifacts in your AppDynamics Event Service home directory. To resolve the issue, terminate the processes and delete the files. You will now be able to restart the Event Service. This issue generally occurs when a machine is crashed or a command, such as kill -9, is used to forcefully terminate the processes.

Analytics Agent Won't Start
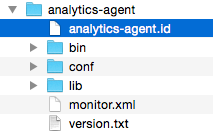
If the Analytics Agent Java process is not shut down gracefully, it will leave an analytics-agent.id artifact in your analytics-agent directory. Delete this file and restart the Agent. This issue generally occurs when a machine crashes or a command, such as kill -9, is used to forcefully terminate the process.
Analytics Agent Is Not Sending Data
Double check the installation instructions to make sure you have set the correct property values, such as Name, Global Account Name and Access Key, and make sure the Analytics Agent can communicate with the necessary destinations (Controller and Events Service) and is not blocked by a firewall.
Permissions Errors / Unable to View Data in the UI
Make sure the authenticated user has the appropriate analytics permissions.
Agents Properly Configured but Data Not Showing Up in UI
Analytics License
Make sure the user is appropriately licensed for Analytics.
Transaction Analytics
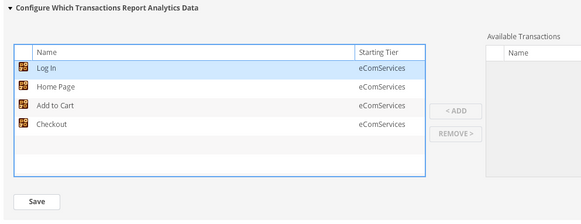
Make sure you have enabled the selected application for analytics data collection.
Make sure you have selected the right Business Transactions.
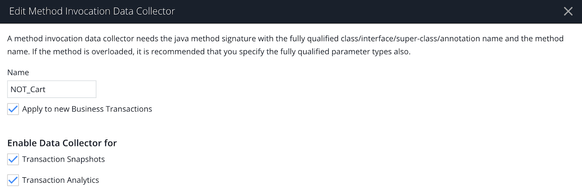
Transaction Analytics is by default is enabled for Method Invocation Data Collector. However, make sure if it’s selected.
Transaction Analytics Not All Showing Default Field Data
If you see a similar message to what’s shown in the image below, it is likely that you have installed the Analytics Agent on a downstream tier and not on the starting tier for those Business Transactions.
Log Analytics Data Not Showing Up
- Double check the Configure Log Analytics settings to make sure you have the correct source rule configuration or job files to collect logs.
- Make sure the Analytics Agent can communicate with the necessary destinations and are not blocked by a firewall.
- Look at
analytics-agent.logto ensure that no errors exist and the files are being read. - Make sure you are looking at the right time window in the UI for when the log records were read in.
Log Analytics Data Issues
- Make sure you check your GROK patterns and
eventTimeStamp. - Double check for special characters that could be causing an issue.
Related Resources
- Product Overview: What is Business iQ?
- Documentation: Application Analytics
- Videos: Business iQ Tutorials
- KB Article: Getting Started with Business iQ
-
KB Article: Use Cases: How are customers using Business iQ for AppDynamics?
Discover new Splunk integrations and AI innovations for Cisco AppDynamics.
Register Now!
Dive into our Community Blog for the Latest Insights and Updates!
Read the blog here

Thank you! Your submission has been received!
Thank you! Your submission has been received!
Oops! Something went wrong while submitting the form


