- Community Hub
- Forum Q&A
- Business iQ (Analytics)
- Controller (SaaS, On Premise)
- Dashboards
- Dynamic Languages (Node.JS, Python, PHP, C/C++, Webserver Agent)
- End User Monitoring (EUM)
- Infrastructure (Server, Network, Database)
- Java (Java Agent, Installation, JVM, and Controller Installation)
- Licensing (including Trial)
- .NET (Agent, Installation)
- Smart Agent
- General Discussions
- Resources
- Groups
- Idea Exchange
Not a customer? Click the 'Start a free trial' link to begin a 30-day SaaS trial of our product and to join our community.
Existing Cisco AppDynamics customers should click the 'Sign In' button to authenticate to access the community
- Cisco AppDynamics Community
- Resources
- Knowledge Base
- How do I find and configure missing entry points?
- Subscribe to RSS Feed
- Mark as New
- Mark as Read
- Bookmark
- Subscribe
- Printer Friendly Page
- Report Inappropriate Content
- Article History
- Subscribe to RSS Feed
- Mark as New
- Mark as Read
- Bookmark
- Subscribe
- Printer Friendly Page
- Report Inappropriate Content
on 02-13-2015 12:55 PM - edited on 02-11-2019 01:49 PM by Nina.Wolinsky
Contents:
Who would use this workflow?
Note: This workflow has largely been replaced by the Live Mode feature.
If you don't see expected activity in your application, you might be missing an entry point at the start of the activity. Use the find-entry-points node property to configure missing entry points for any Business Transactions (BTs) that aren't detected out-of-the-box (OOTB). This property enables additional logging about the call stack of the app's executing code.
In many cases, the OOTB configuration instruments entry points so this workflow isn't usually necessary. You would only use these instructions if your code is built within a framework that isn't supported by the out-of-the-box configuration. However, we recommend using the Live Mode feature instead.
How do I know which POJO to instrument?
Three rules to keep in mind:
- Select the POJO at the earliest point possible in the call stack.
- Select a POJO that finishes.
- You are instrumenting a POJO to measure the time the business transaction takes to execute, so you must select a POJO that finishes.
- Select a POJO that results in a meaningful name.
- The entry point method determines the name of the BT.
NOTE: Do not pick a method that never ends, such as a run () method that waits on a user request! See: POJO Entry Points.
Implementation:
- Navigate to node-level agent configuration and set the
find-entry-pointsproperty to true. - For more information on how to edit a node-level property: Edit a Registered Node Property
- Apply the property either tier-level or node-level.
- Note: Do not turn on this property tier-level within a production environment. The find-entry-points property is meant to be used under pre-prod and non-prod environments.
- Once the property is applied, apply sufficient load on the application and start collecting agent logs from the Controller UI, or view them from agent installation folder. Debug logging is not needed for this property.
- A complete call stack from the instrumentor to the top of the thread will dump to the
BusinessTransactions<X>.logfile. - Example:
BusinessTransactions.2017_11_27__12_54_08.0.log - The BT log mixes the output of find-entry-points with the "normal" BT discovery logging.
- To distinguish between the two types of call stacks, identify the text after the INFO log level keyword.
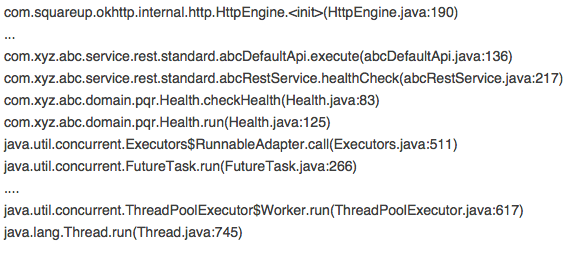
- Entire stack trace with eligible entry point prioritized:
- Based on this output, the user can find eligible candidates and create custom POJO entry points.
- One can create a custom POJO entry point on class
com.xyz.abc.domain.pqr.Healthand method run. - In the above example, 0th is considered as most eligible entry priority. Based on the output, a custom entry point rule can be created on any type (ex: Servlet, EJB, Spring or POJO).
- More information: Custom Match Rules.
Note: Setting the property value to true causes verbose logging to be output until the value is switched to false, so it is unwise to leave this property value set to true.
Limitations
If the application has no known exit calls, such as no HTTP, web services, JDBC, etc, then no call stacks are logged when you run find entry points.
To work around this limitation, set a custom exit point to force the logging of the associated call stack, then run find entry points again. The log entry at the top of the call stack should be your custom exit point. This works best when you know a method in the business functionality or user request that you are trying to measure. See Configure Custom Exit Points.
Published on 2/13/2015
Updated 2/11/19
Learn how Splunk and AppDynamics are redefining observability
Watch Now!
Dive into our Community Blog for the Latest Insights and Updates!
Read the blog here

Thank you! Your submission has been received!
Thank you! Your submission has been received!
Oops! Something went wrong while submitting the form


