- Community Hub
- Forum Q&A
- Business iQ (Analytics)
- Controller (SaaS, On Premise)
- Dashboards
- Dynamic Languages (Node.JS, Python, PHP, C/C++, Webserver Agent)
- End User Monitoring (EUM)
- Infrastructure (Server, Network, Database)
- Java (Java Agent, Installation, JVM, and Controller Installation)
- Licensing (including Trial)
- .NET (Agent, Installation)
- Smart Agent
- General Discussions
- Resources
- Groups
- Idea Exchange
Not a customer? Click the 'Start a free trial' link to begin a 30-day SaaS trial of our product and to join our community.
Existing Cisco AppDynamics customers should click the 'Sign In' button to authenticate to access the community
- Cisco AppDynamics Community
- Resources
- Knowledge Base
- How do I build my traffic profile for Analytics in...
- Subscribe to RSS Feed
- Mark as New
- Mark as Read
- Bookmark
- Subscribe
- Printer Friendly Page
- Report Inappropriate Content
- Article History
- Subscribe to RSS Feed
- Mark as New
- Mark as Read
- Bookmark
- Subscribe
- Printer Friendly Page
- Report Inappropriate Content
on
02-11-2020
02:22 PM
- edited on
02-12-2020
09:59 AM
by
Claudia.Landiva
When planning instrumentation for deploying Analytics on-prem, how do I build the traffic profile?
Table of Contents
- How do I understand my traffic for sizing?
- How do I consider EUM usage when building my Events Service traffic profile?
How do I understand my traffic for sizing?
Understanding the characteristics of your traffic is the foundation for successful sizing. To build a traffic profile, answer the following questions.
If I have Business Transactions (BTs) in an APM application I want to enable Analytics on:
- Is it a new or an existing APM application?
- Do I have Log Analytics licenses?
- Additional estimate methods
Am I seeking to enable Analytics on an existing or new APM application? |
|
Existing APM application |
|
New APM application |
|
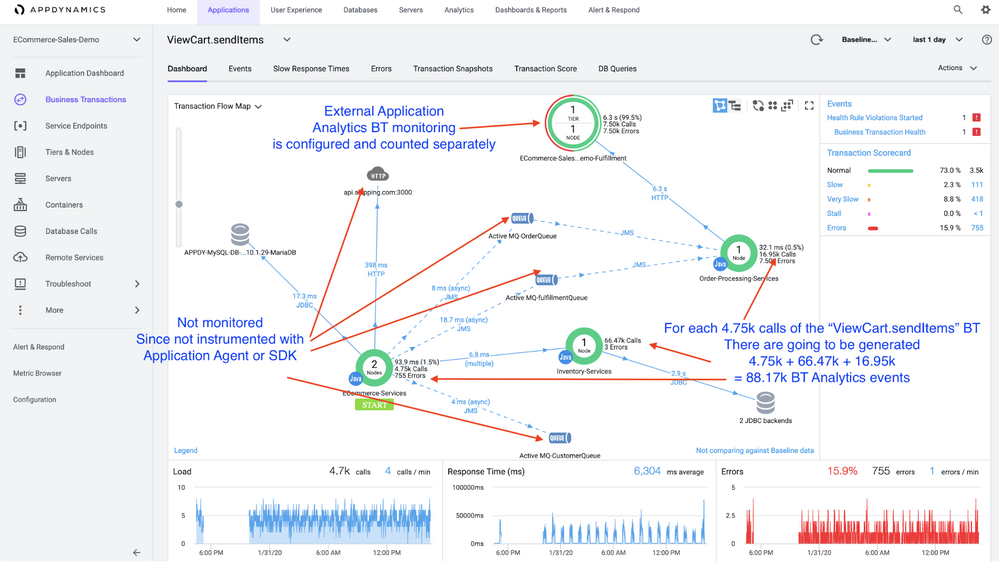
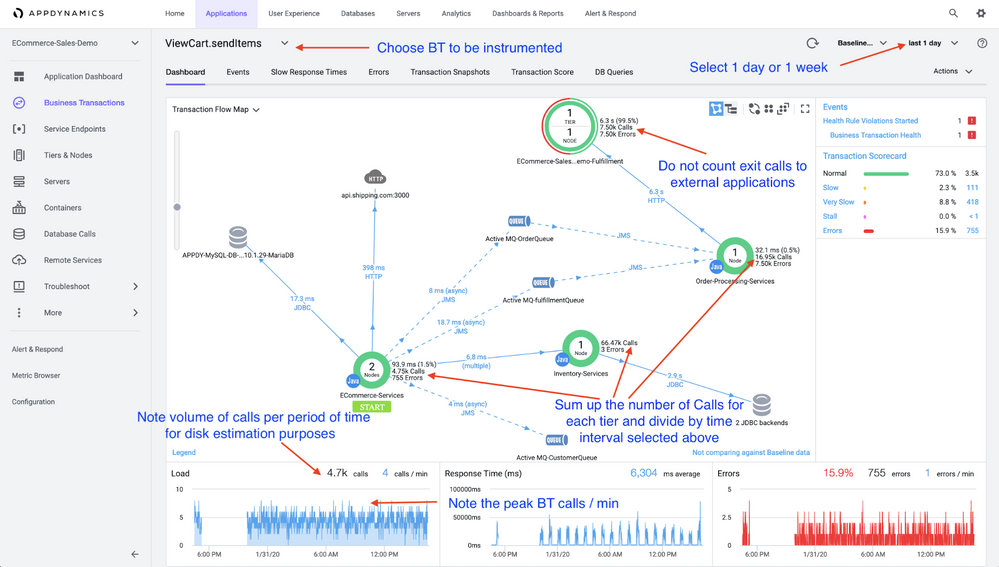
Figure 1 shows an example of how many BT events per tier are generated. Figure 2 shows the estimated number of events per APM BT.
A tier can be called multiple times by originating BT, thus producing multiple events. If the request performs asynchronous calls on a single node then it's possible that a single request on a single tier could output multiple segments (events). Each async thread call becomes its own segment in the Java Agent. In .NET, results from an async call could be merged into one or more segments (events).
Figure 1: Example of how many BT events per tier are generated
Figure 2: Estimated number of events per APM BT
Do I have Log Analytics licenses? |
|
|
If so, then:
Avg number of lines per source number 1 =
|
You can also use these additional estimation methods:
What licenses do you have? |
|
What is the shape of traffic over time? |
|
What are typical numbers for concurrent users? |
|
What are typical patterns of user behavior? |
|
Mobile app crash rate |
|
How do I consider End User Management (EUM) usage when building my Events Service traffic profile?
Unlike Business Transaction (BT) or Log Analytics licenses, the number of EUM licenses does not translate into a good basis to estimate what size machine can support a particular deployment. EUM performance depends on the number of beacons.
To accurately estimate expected beacons, you must understand:
- The millions of browser page views and/or IOT events allowed by the licenses can be distributed in many ways over the year. Temporal distribution of traffic is key.
- Mobile licenses, by contrast, allow some thousands of mobile agents to connect per month—but any of those agents can send an unlimited number of requests. User behavior is key.
When building the traffic profile, you need detailed and accurate information.
The following will help you determine the projected EUM Analytics load:
Browser Request User Monitoring (BRUM) |
|
How many page views? |
|
Mobile Request User Monitoring (MRUM) |
|
Internet of Things (IoT) |
|
This table lists the unit-to-beacon relationship for each EUM license type.
EUM
|
Units |
Unit-to-Beacon Relationship |
BRUM |
one million page views/year |
One to one |
IoT |
TBD million IOT events/year |
One to one |
MRUM |
5K mobile agents/month |
No unit-beacon relationship can be derived because:
|
EUM license types and their unit-to-beacon relationships
Note: For up-to-date licensing information for EUM Analytics, click here.
Note: By default, each EUM Analytics event type is limited to 50GB per day. You can adjust that limit inside each Events Service node’s properties located in this directory: <Events-Service-Home>/conf/events-service-api-store.properties in the ad.es.event.maxDailyEventTypeBytesQuota folder
Learn how Splunk and AppDynamics are redefining observability
Watch Now!
Dive into our Community Blog for the Latest Insights and Updates!
Read the blog here

Thank you! Your submission has been received!
Thank you! Your submission has been received!
Oops! Something went wrong while submitting the form

