- Community Hub
- Forum Q&A
- Business iQ (Analytics)
- Controller (SaaS, On Premise)
- Dashboards
- Dynamic Languages (Node.JS, Python, PHP, C/C++, Webserver Agent)
- End User Monitoring (EUM)
- Infrastructure (Server, Network, Database)
- Java (Java Agent, Installation, JVM, and Controller Installation)
- Licensing (including Trial)
- .NET (Agent, Installation)
- Smart Agent
- General Discussions
- Resources
- Groups
- Idea Exchange
Not a customer? Click the 'Start a free trial' link to begin a 30-day SaaS trial of our product and to join our community.
Existing Cisco AppDynamics customers should click the 'Sign In' button to authenticate to access the community
- Cisco AppDynamics Community
- Resources
- Knowledge Base
- Custom Dashboard for QA Teams
- Subscribe to RSS Feed
- Mark as New
- Mark as Read
- Bookmark
- Subscribe
- Printer Friendly Page
- Report Inappropriate Content
- Article History
- Subscribe to RSS Feed
- Mark as New
- Mark as Read
- Bookmark
- Subscribe
- Printer Friendly Page
- Report Inappropriate Content
on 01-29-2015 01:34 PM - edited on 11-28-2018 02:56 PM by Nina.Wolinsky
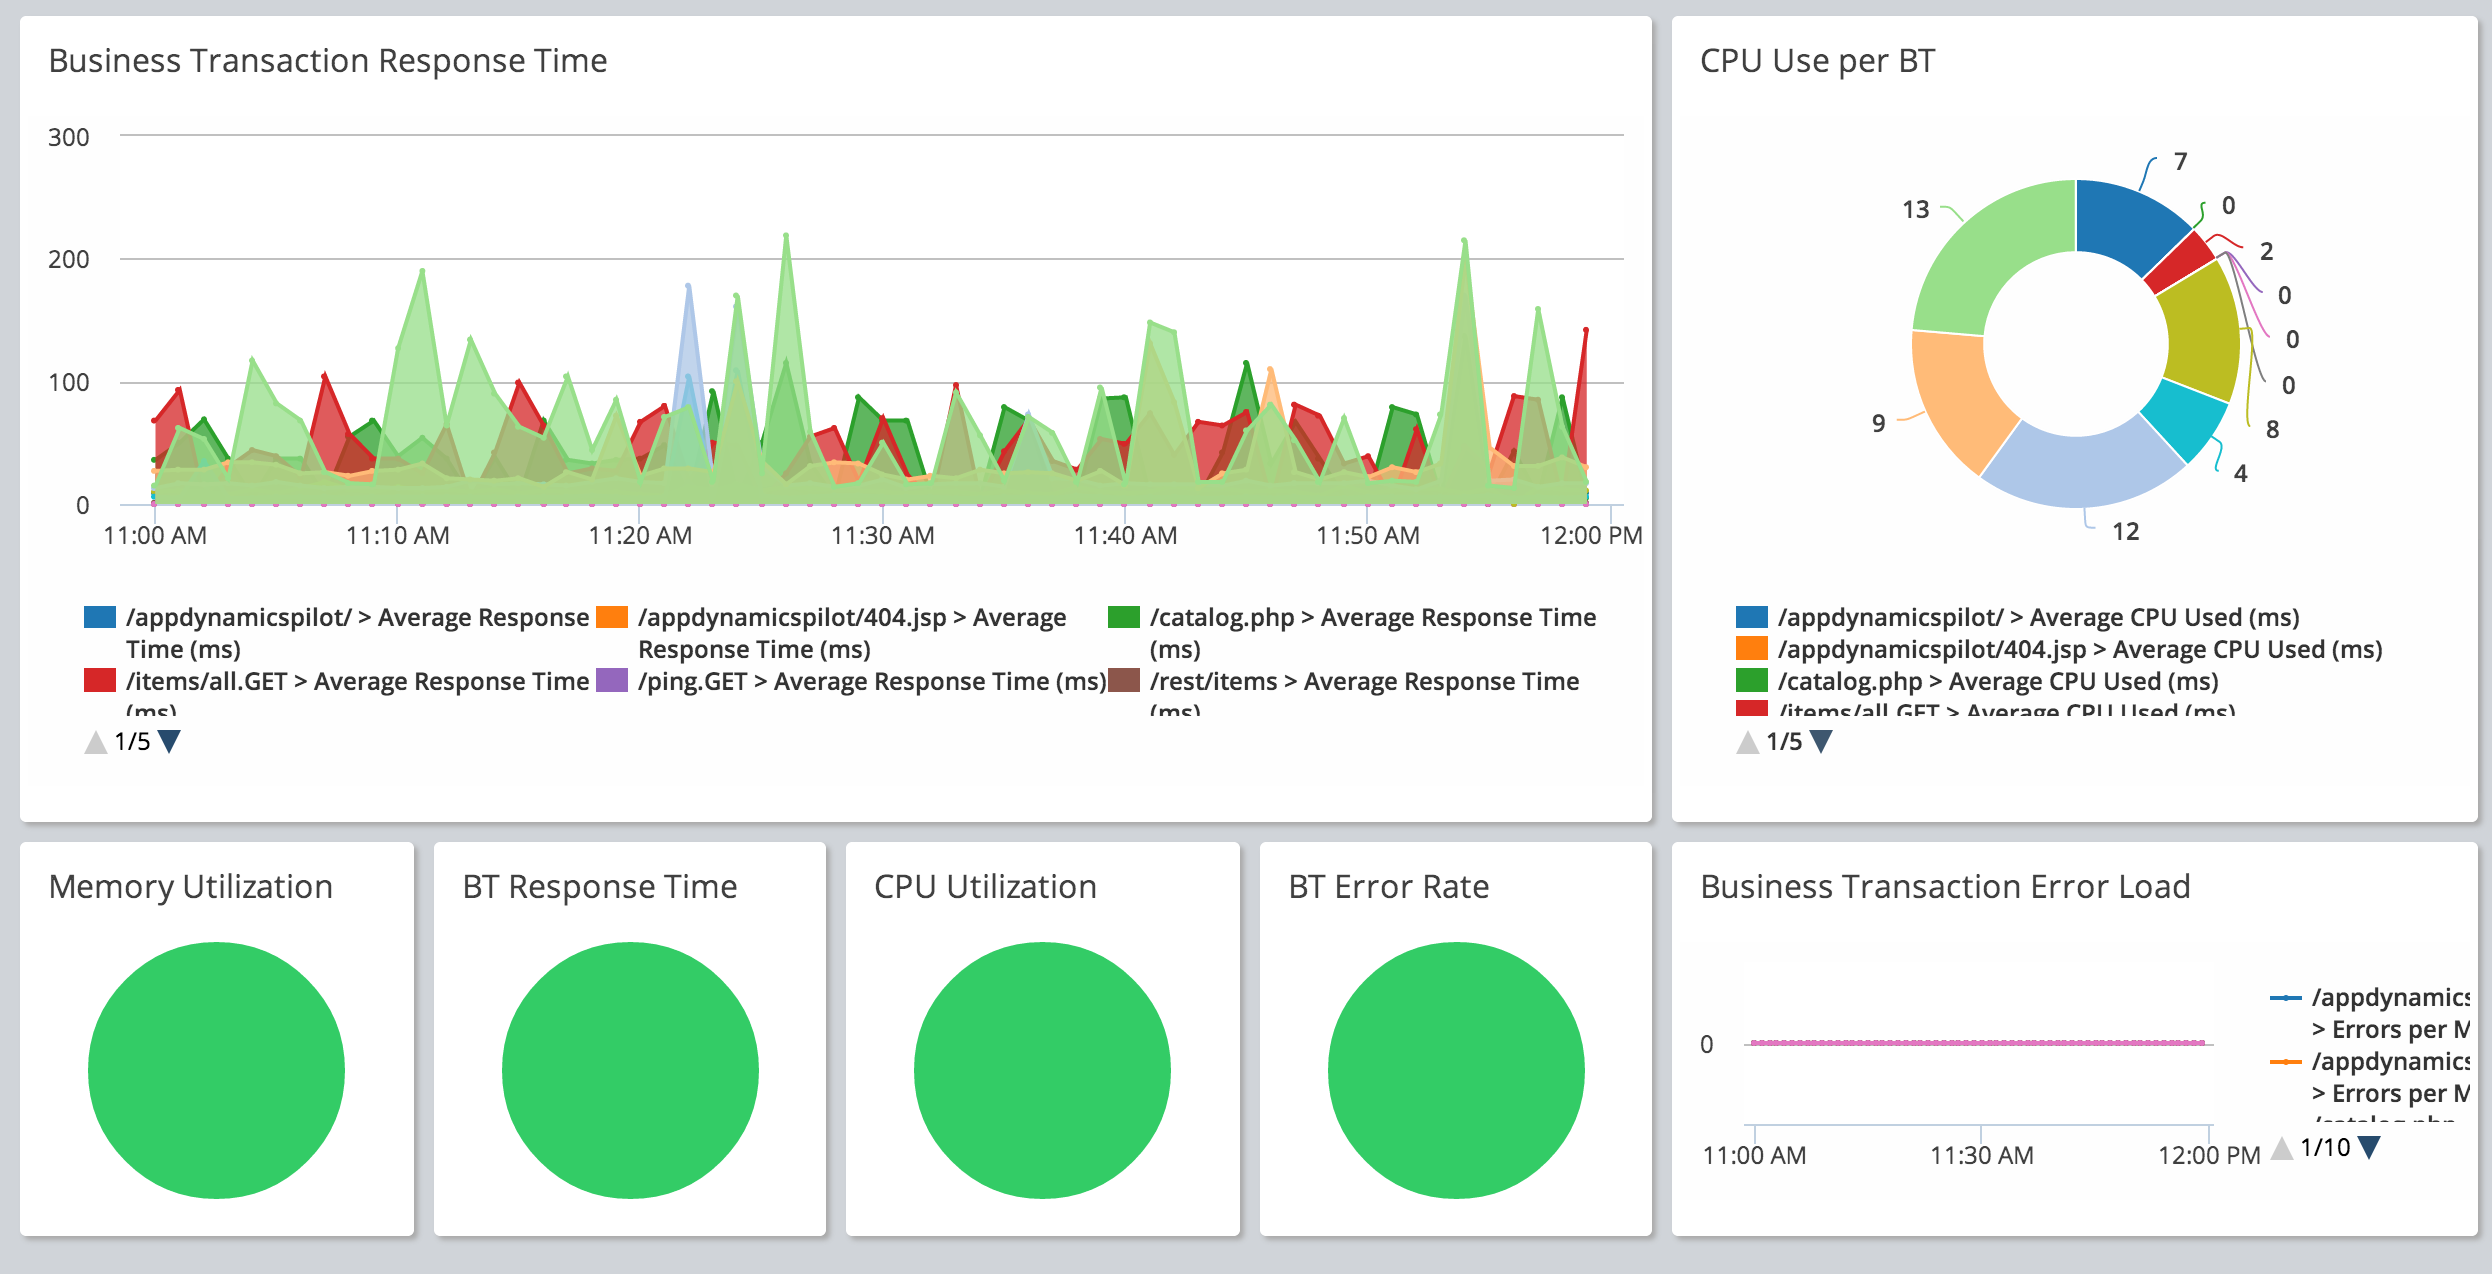
To use this dashboard layout, import the attached QA-Dashboard.xml file and follow the instructions to rebind similar metrics in another application.
- Log in to your Controller UI.
- Navigate to the Custom Dashboards list screen.
- Import the QA-Dashboard.xml file.
- Rebind the metrics which correspond for your particular application. To do this, you edit each displayed widget in the dashboard, select your application and then confirm or select the metric for that display.
If you need detailed instructions for working with custom dashboard widgets, please visit docs.appdynamics.com and view Create Custom Dashboards.
Learn how Splunk and AppDynamics are redefining observability
Watch Now!
Dive into our Community Blog for the Latest Insights and Updates!
Read the blog here

Thank you! Your submission has been received!
Thank you! Your submission has been received!
Oops! Something went wrong while submitting the form
