- Community Hub
- Forum Q&A
- Business iQ (Analytics)
- Controller (SaaS, On Premise)
- Dashboards
- Dynamic Languages (Node.JS, Python, PHP, C/C++, Webserver Agent)
- End User Monitoring (EUM)
- Infrastructure (Server, Network, Database)
- Java (Java Agent, Installation, JVM, and Controller Installation)
- Licensing (including Trial)
- .NET (Agent, Installation)
- Smart Agent
- General Discussions
- Resources
- Groups
- Idea Exchange
Not a customer? Click the 'Start a free trial' link to begin a 30-day SaaS trial of our product and to join our community.
Existing Cisco AppDynamics customers should click the 'Sign In' button to authenticate to access the community
- Cisco AppDynamics Community
- Forums Q&A
- Java
- Re: Overall Application Performance(Error/Min) les...
- Subscribe to RSS Feed
- Mark Topic as New
- Mark Topic as Read
- Float this Topic for Current User
- Bookmark
- Subscribe
- Mute
- Printer Friendly Page
Overall Application Performance(Error/Min) less than Errors(Pagenotfound 404(XX_TIER) - Error/Min
- Mark as New
- Bookmark
- Subscribe
- Mute
- Subscribe to RSS Feed
- Permalink
- Report Inappropriate Content
02-22-2018 03:26 AM
Hi ,
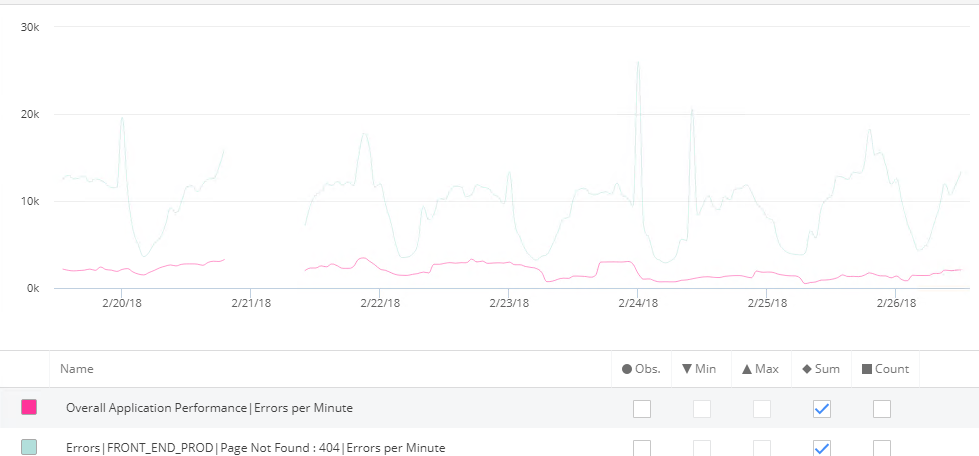
When we plot the graph for Overall Application Performance(Error/Min) less than Errors(Pagenotfound 404(XX_TIER) - Error/Min.
My question is how the Overall Application Perforamance (Sum of all error&Exceptions in application) is less than Particukar tiers page not found 404 error?
Kindly any one help us to understand. how the Error/min calculate on Overall Application Performance and Errors sections.
Please find the below graph. Thanks in Advance!
- Mark as New
- Bookmark
- Subscribe
- Mute
- Subscribe to RSS Feed
- Permalink
- Report Inappropriate Content
02-22-2018 08:09 AM
Can you try to plot the count metric instead of the observed value?
- Mark as New
- Bookmark
- Subscribe
- Mute
- Subscribe to RSS Feed
- Permalink
- Report Inappropriate Content
02-23-2018 10:34 AM
I meant sum* an dnot count.
- Mark as New
- Bookmark
- Subscribe
- Mute
- Subscribe to RSS Feed
- Permalink
- Report Inappropriate Content
02-26-2018 01:46 AM
Hi,
Thanks for your reply!
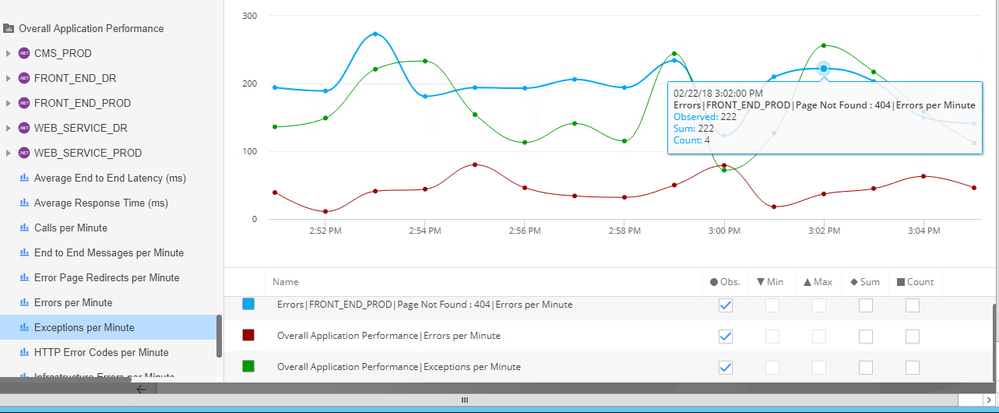
I tried the SUM but now also Overall app performance error > page not found 404(XX_TIER) and here is the screenshot

- Mark as New
- Bookmark
- Subscribe
- Mute
- Subscribe to RSS Feed
- Permalink
- Report Inappropriate Content
02-27-2018 04:28 AM
Hi All,
Below is the answer for my query, hope it helps others as well
Overall Application Performance|Errors per Minute & Overall Application Performance|Exceptions per Minute capture the Errors/Exceptions from the Business Transaction (BT) contexts.
Whereas Errors|<TierName>|<Exception>|Errors per Minute reports the Errors regardless of the BT contexts. Hence these two are not comparable as such. Also the later one can be higher than the other.
https://docs.appdynamics.com/display/PRO43/Errors+and+Exceptions - Refernece Link
Thanks
Soorya Mohan
Learn how Splunk and AppDynamics are redefining observability
Register Now!
Dive into our Community Blog for the Latest Insights and Updates!
Read the blog here
- Misatched counts in metric browser in Java (Java Agent, Installation, JVM, and Controller Installation)
- Enhancing AppDynamics Real User Monitoring for Pega CDH Portal: Challenges with Campaigns and SPA in End User Monitoring (EUM)
- To monitor Java-based microservices running in Docker with AppDynamics in Java (Java Agent, Installation, JVM, and Controller Installation)
- encrpted user credentials for dotnet core in NET (Agent, Installation)
- AppD Java Agent for Web Apps - ClaasNotFound Error in Java (Java Agent, Installation, JVM, and Controller Installation)

Thank you! Your submission has been received!
Thank you! Your submission has been received!
Oops! Something went wrong while submitting the form
