- Community Hub
- Forum Q&A
- Business iQ (Analytics)
- Controller (SaaS, On Premise)
- Dashboards
- Dynamic Languages (Node.JS, Python, PHP, C/C++, Webserver Agent)
- End User Monitoring (EUM)
- Infrastructure (Server, Network, Database)
- Java (Java Agent, Installation, JVM, and Controller Installation)
- Licensing (including Trial)
- .NET (Agent, Installation)
- Privacy and Security
- Smart Agent
- General Discussions
- Resources
- Groups
- Idea Exchange
Not a customer? Click the 'Start a free trial' link to begin a 30-day SaaS trial of our product and to join our community.
Existing Cisco AppDynamics customers should click the 'Sign In' button to authenticate to access the community
- Cisco AppDynamics Community
- Forums Q&A
- Infrastructure
- Re: VMWare - Monitoring Extension
- Subscribe to RSS Feed
- Mark Topic as New
- Mark Topic as Read
- Float this Topic for Current User
- Bookmark
- Subscribe
- Mute
- Printer Friendly Page
- Mark as New
- Bookmark
- Subscribe
- Mute
- Subscribe to RSS Feed
- Permalink
- Report Inappropriate Content
05-03-2023 03:09 AM
We are looking to use the VMWare - Monitoring Extension
I need some clarification if this extension uses Vcenter or if host info needs to be captured in the config file for each VM and Host managed by Vcenter?
The documentation is not very clear on that or the specific permissions required for the user that does authentication.
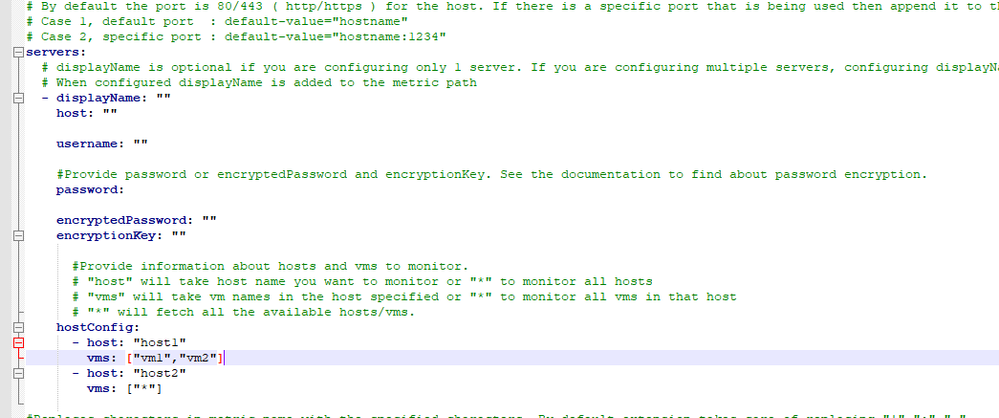
See image below for reference.
What is the difference between the "host" in the servers section at the top of the config and the "host" in the hostconfig section further down. Which one do we use if our client's Vcenter is managing 200 Hosts?

Solved! Go to Solution.
- Mark as New
- Bookmark
- Subscribe
- Mute
- Subscribe to RSS Feed
- Permalink
- Report Inappropriate Content
05-03-2023 06:59 AM
Hi Dietrich,
 - displayName: ""
    host: ""
hostConfig:
      - host: ""
        vms: ["*"]
- Mark as New
- Bookmark
- Subscribe
- Mute
- Subscribe to RSS Feed
- Permalink
- Report Inappropriate Content
05-03-2023 11:17 PM
Hi Arun
Thanks for the input.
Do you know anything more about the permissions the user account requires that authenticates with vCenter?
- Mark as New
- Bookmark
- Subscribe
- Mute
- Subscribe to RSS Feed
- Permalink
- Report Inappropriate Content
05-08-2023 03:50 AM - last edited on 05-10-2023 06:16 AM by Ryan.Paredez
Hi Dietrich
It seems it needs admin/root-level permission.
Regards,Atyuha
- Mark as New
- Bookmark
- Subscribe
- Mute
- Subscribe to RSS Feed
- Permalink
- Report Inappropriate Content
05-10-2023 04:25 AM
Thanks for the input Arun and Atyuha.
I am marking this as solved as I got the answers I needed. Just waiting for the client to come back to me before we can proceed with the actual testing.
Dietrich
- Mark as New
- Bookmark
- Subscribe
- Mute
- Subscribe to RSS Feed
- Permalink
- Report Inappropriate Content
10-23-2023 05:33 AM
Just updating this old post with the info that we never reached the implementation part of this extension because the client went another route. So my knowledge on this is about as extensive as the above posts.
- Mark as New
- Bookmark
- Subscribe
- Mute
- Subscribe to RSS Feed
- Permalink
- Report Inappropriate Content
10-25-2023 01:44 PM
Hi Deitrich,
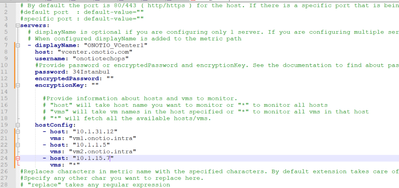
first "host" after "displayName" option defines VCenter's IP address
for example, if your vmcenter's service URL is like this below
you need to define like this below
If you want to monitor all VMhosts in this Vcenter (in your example you mention approx 200 VmHost ) and All VMs in these 200 VMhosts, your hostConfig section must be like this below.
This means getting all VmHosts' metrics and all VMs' metrics which is under these 200 VmHost. But with this configuration based on your VMs and VmHost count, you need to increase "numberofThreads" Counts (for example 10-15 or 20) and machine agents agent max metrics value (default value is 450, too less for this kind of scenario)
for 10000 metrics you need to install a machine agent with Java options below.
-Dappdynamics.agent.maxMetrics=10000
to sum up I'm giving enough examples for your all hidden question below
This config yml gathering metrics from vcenter.onotio.com for 3 diferent Vm Host:
10.1.31.12
10.1.1.5
10.1.15.7
and also
vm1.onotio.intra ' s VM metrics
vm2.onotio.infra' s VM metric
and all VMs' metrics from 10.1.15.7 VmHost.
If you need further help please feel free.
Thanks
Cansel
- Mark as New
- Bookmark
- Subscribe
- Mute
- Subscribe to RSS Feed
- Permalink
- Report Inappropriate Content
11-04-2024 03:00 AM
What should be the configuration if we only need to monitor ESXi hosts but not VMs via this extension. I believe because of vmware technicalities performance metric values like CPU,Memory, Disk Utilizations values differs when monitored as VM via vcenter discovery vs when it is monitored as server
- Mark as New
- Bookmark
- Subscribe
- Mute
- Subscribe to RSS Feed
- Permalink
- Report Inappropriate Content
11-07-2024 10:35 AM
Hi @Mukesh.Prasad,
Since this post is over a year old, it may not get a reply. Since it's been a few days, did you happen to find a solution yourself you can share?
If you still need help, you can contact AppD Support: How to contact AppDynamics Support and manage existing cases with Cisco Support Case Manager (SCM)
Thanks,
Ryan, Cisco AppDynamics Community Manager
Found something helpful? Click the Accept as Solution button to help others find answers faster.
Liked something? Click the Thumbs Up button.
Check out Observabiity in Action
new deep dive videos weekly in the Knowledge Base.
Learn how Splunk and AppDynamics are redefining observability
Register Now!
Dive into our Community Blog for the Latest Insights and Updates!
Read the blog here
- Getting error post installing Linux Monitoring Extension to monitor NFS in Infrastructure (Server, Network, Database)
- Exlore & Expand | Custom configuration files, monitors, and extensions for agent management in Smart Agent
- VMWare Monitoring - Extension Compilation in Infrastructure (Server, Network, Database)
- Do we have any extension for Redis-Cluster Nodes Monitoring in Dashboards
- Building a Monitoring Extension Using Scripts in Infrastructure (Server, Network, Database)
| User | Count |
|---|---|
| 2 | |
| 1 | |
| 1 | |
| 1 | |
| 1 | |
| 1 |

Thank you! Your submission has been received!
Thank you! Your submission has been received!
Oops! Something went wrong while submitting the form


