Building a Monitoring Extension Using Scripts
- Mark as New
- Bookmark
- Subscribe
- Mute
- Subscribe to RSS Feed
- Permalink
- Report Inappropriate Content
05-16-2023 03:16 PM - last edited on 05-19-2023 03:30 AM by Ryan.Paredez
Hi,
Trying to create POC for building custom monitoring extension from (custom written) scripts.
- Created <machine_agent_home>/monitors/<custom_extension_directory>, in my case that is <machine_agent_home>/monitors/CustomMonitor”.
- In this directory CustomMonitor created two files. First file is shell script that prints stdout in the format of "name=Custom Metrics|Hardware Resources|$ZONE|$server_name conntrack utilization percent,value="$Ctrack_utilization. This works just fine, tested it by running from the server directly, from command prompt.
- created file “monitor.xml” with the following content …
<monitor>
<name>Hardware Resources</name>
<type>managed</type>
<description>Monitor open file count </description>
<monitor-configuration>
</monitor-configuration>
<monitor-run-task>
<execution-style>continuous</execution-style>
<name>Run</name>
<type>executable</type>
<task-arguments>
</task-arguments>
<executable-task>
<type>file</type>
<file><shell_script_file_name></file>
</executable-task>
</monitor-run-task>
</monitor> - restarted machine agent
My data is not visible if i go to Servers > Metric Browser.
Tried modifying monitor.xml to use periodic (since i read somewhere that for "continuous" script needs to run in infinite loop like this ...
<execution-style>periodic</execution-style>
<execution-frequency-in-seconds>60</execution-frequency-in-seconds>
<execution-timeout-in-secs>30</execution-timeout-in-secs>
but my data is still not visible in Metric Browser.
Tried with different format of stdout like this ...
name=Hardware Resources|$ZONE|$server_name conntrack utilization percent,value="$Ctrack_utilization
but that did not help neither.
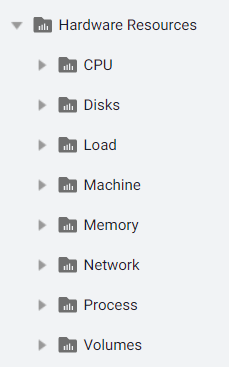
Just to mentioned that in Metric Browser I see relevant server with default metrics, this is what i see under this server (did not include it in the image in order not to reveille the actual server name)
I was hoping to have another expandable folder with the caption of the value of variable $ZONE.
Has anyone successfully managed to get this running?
- Mark as New
- Bookmark
- Subscribe
- Mute
- Subscribe to RSS Feed
- Permalink
- Report Inappropriate Content
05-19-2023 03:32 AM
Hi @Predrag.Spasic,
Since the community did not jump in, you may want to contact AppD Support for this one.
Thanks,
Ryan, Cisco AppDynamics Community Manager
Found something helpful? Click the Accept as Solution button to help others find answers faster.
Liked something? Click the Thumbs Up button.
Check out Observabiity in Action
new deep dive videos weekly in the Knowledge Base.
- Mark as New
- Bookmark
- Subscribe
- Mute
- Subscribe to RSS Feed
- Permalink
- Report Inappropriate Content
08-21-2023 05:13 PM
Am facing the very same issue and followed the exact same steps as you from this Appdynamics help Page but even i cant see my custom metrcs
- Mark as New
- Bookmark
- Subscribe
- Mute
- Subscribe to RSS Feed
- Permalink
- Report Inappropriate Content
08-21-2023 05:14 PM
Any luck if this issue is resolved ?
- Mark as New
- Bookmark
- Subscribe
- Mute
- Subscribe to RSS Feed
- Permalink
- Report Inappropriate Content
10-02-2023 04:59 AM
Its resolved
- Mark as New
- Bookmark
- Subscribe
- Mute
- Subscribe to RSS Feed
- Permalink
- Report Inappropriate Content
10-02-2023 10:55 AM
Hi @sathishkumar.R,
Can you share any insight on what you did or what happened for the issue to be resolved?
Thanks,
Ryan, Cisco AppDynamics Community Manager
Found something helpful? Click the Accept as Solution button to help others find answers faster.
Liked something? Click the Thumbs Up button.
Check out Observabiity in Action
new deep dive videos weekly in the Knowledge Base.

