- Community Hub
- Forum Q&A
- Business iQ (Analytics)
- Controller (SaaS, On Premise)
- Dashboards
- Dynamic Languages (Node.JS, Python, PHP, C/C++, Webserver Agent)
- End User Monitoring (EUM)
- Infrastructure (Server, Network, Database)
- Java (Java Agent, Installation, JVM, and Controller Installation)
- Licensing (including Trial)
- .NET (Agent, Installation)
- Privacy and Security
- Smart Agent
- General Discussions
- Resources
- Groups
- Idea Exchange
Not a customer? Click the 'Start a free trial' link to begin a 30-day SaaS trial of our product and to join our community.
Existing Cisco AppDynamics customers should click the 'Sign In' button to authenticate to access the community
- Cisco AppDynamics Community
- Forums Q&A
- EUM
- Re: I am trying to export the status code and ajax...
- Subscribe to RSS Feed
- Mark Topic as New
- Mark Topic as Read
- Float this Topic for Current User
- Bookmark
- Subscribe
- Mute
- Printer Friendly Page
How to export the status code and ajax error code from browser snapshot data for analytics purpose?
- Mark as New
- Bookmark
- Subscribe
- Mute
- Subscribe to RSS Feed
- Permalink
- Report Inappropriate Content
08-10-2021 08:20 PM - last edited on 09-21-2021 09:40 AM by Ryan.Paredez
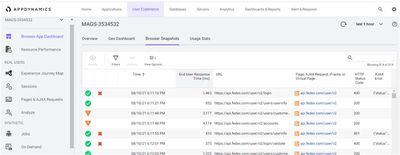
I am trying to export the status code and ajax error code in user experience from browser snapshot data of respective requests for our analytics purpose? Is there any way to do this?
I tried with multiple options but am not sure how will be able to export these.
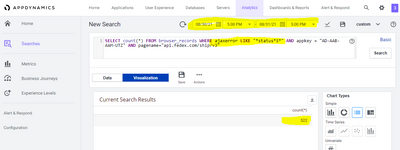
I have used analytics API as an alternative to fetch these values but I see ajax error value is always captured null for all the requests on the analytics level.
You can see above our requirement is to just capture this status code and ajax error code for the respective API.
Please help me with this.
- Mark as New
- Bookmark
- Subscribe
- Mute
- Subscribe to RSS Feed
- Permalink
- Report Inappropriate Content
08-27-2021 11:04 AM - last edited on 09-01-2021 09:37 AM by Ryan.Paredez
Hi Team,
Thank you for the update!!
Is there any way to delete the custom metric that we have created on AppDynamics from the ADQL query on the analytics level as you suggested below?
Thanks and Regards,
Dhiraj Kumar
Post edited by @Claudia.Landivar to remove a phone number. Please do not share your or other phone numbers on community posts.
- Mark as New
- Bookmark
- Subscribe
- Mute
- Subscribe to RSS Feed
- Permalink
- Report Inappropriate Content
08-30-2021 12:36 AM - last edited on 09-02-2021 09:46 AM by Ryan.Paredez

- Mark as New
- Bookmark
- Subscribe
- Mute
- Subscribe to RSS Feed
- Permalink
- Report Inappropriate Content
09-01-2021 07:50 AM - last edited on 09-02-2021 09:47 AM by Ryan.Paredez
Hi Team,
Thank you for your quick response!!
One strange behavior we observed in AppDynamics Ajax error code(500 series error) count in analytics through ADQL and browser snapshot((500 series error))for the same base URL.
For Analytics above we get the count 522 for Ajax error code 500 series.
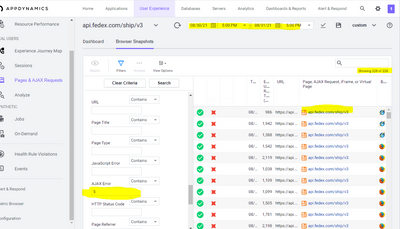
But for the same when we verified from browser snapshot as per my understanding for the same page name we should be getting the same count but we are getting only 228 counts for the same time range as you can see below.
why is there a difference in count in browser snapshot data and data we get through ADQL?
Do we have any restriction on the total no of counts that we get on browser snapshot data?
Please clarify that point. It would be really helpful in order to implement the same on the project level as we are planning to create some custom metrics using an ADQL analytics query. We observed these differences so just looking for some clarification to avoid any discrepancies later point in time.
Thanks and Regards,
Dhiraj Kumar
- Mark as New
- Bookmark
- Subscribe
- Mute
- Subscribe to RSS Feed
- Permalink
- Report Inappropriate Content
09-01-2021 10:18 PM - last edited on 09-02-2021 09:47 AM by Ryan.Paredez
- Mark as New
- Bookmark
- Subscribe
- Mute
- Subscribe to RSS Feed
- Permalink
- Report Inappropriate Content
09-08-2021 10:03 AM
Hello @Dhiraj.Choudhary,
Did you have any more follow-up questions for @Hiroki.Ito? Did he help answer your question? If so, be sure to click on the Accepted Solution button on one of his replies.
Thanks,
Ryan, Cisco AppDynamics Community Manager
Found something helpful? Click the Accept as Solution button to help others find answers faster.
Liked something? Click the Thumbs Up button.
Check out Observabiity in Action
new deep dive videos weekly in the Knowledge Base.
- Mark as New
- Bookmark
- Subscribe
- Mute
- Subscribe to RSS Feed
- Permalink
- Report Inappropriate Content
02-06-2024 06:06 AM
Hi!
How did you get the http status code on BRUM?
Regards,
- « Previous
-
- 1
- 2
- Next »
Learn how Splunk and AppDynamics are redefining observability
Register Now!
Dive into our Community Blog for the Latest Insights and Updates!
Read the blog here
- ClassNotFoundException: com.appdynamics.apm.appagent.api.NoOpInvocationHandler in Java (Java Agent, Installation, JVM, and Controller Installation)
- Get a full URL of a slow Transaction Snapshot in NET (Agent, Installation)
- Events service shows critical after fresh installation in Controller (SaaS, On Premises)
- Starting Events Service cluster in Business iQ (Analytics)

Thank you! Your submission has been received!
Thank you! Your submission has been received!
Oops! Something went wrong while submitting the form


