- Community Hub
- Forum Q&A
- Business iQ (Analytics)
- Controller (SaaS, On Premise)
- Dashboards
- Dynamic Languages (Node.JS, Python, PHP, C/C++, Webserver Agent)
- End User Monitoring (EUM)
- Infrastructure (Server, Network, Database)
- Java (Java Agent, Installation, JVM, and Controller Installation)
- Licensing (including Trial)
- .NET (Agent, Installation)
- Privacy and Security
- Smart Agent
- General Discussions
- Resources
- Groups
- Idea Exchange
Not a customer? Click the 'Start a free trial' link to begin a 30-day SaaS trial of our product and to join our community.
Existing Cisco AppDynamics customers should click the 'Sign In' button to authenticate to access the community
- Cisco AppDynamics Community
- Forums Q&A
- Controller
- Difference for exception count number on summary a...
- Subscribe to RSS Feed
- Mark Topic as New
- Mark Topic as Read
- Float this Topic for Current User
- Bookmark
- Subscribe
- Mute
- Printer Friendly Page
Difference for exception count number on summary and individual exception page
- Mark as New
- Bookmark
- Subscribe
- Mute
- Subscribe to RSS Feed
- Permalink
- Report Inappropriate Content
02-23-2021 12:25 PM
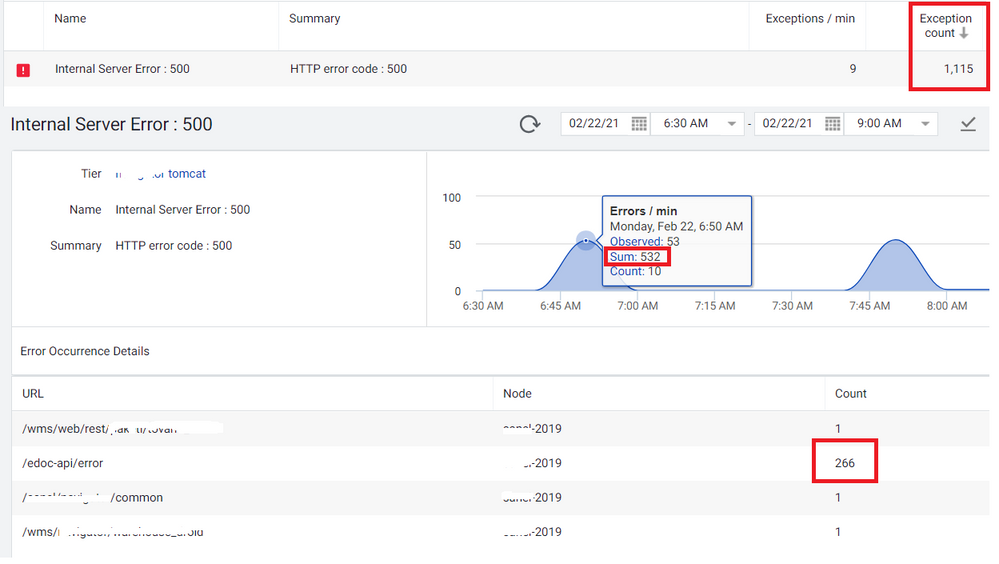
As the picture is suggesting, I cannot comprehend how the exception count number can be so different when I am looking at the summary page (the upper portion of my screenshot), and the exception detail page (lower portion)? I removed some sensitive URL and node info from the picture but that's not relevant of course.
So:
- When I open the errors->exceptions page to find what are the exceptions with the biggest count number, I find that http error 500 appeared 1115 times in the last 2.5 hours. That's 9 exception per minute according to appdynamics, but when you divide 1115 over 150 (minutes) you get 7.43 - which should yield either 7 or 8 exceptions per minute, not 9. But I can live with that, we have something else here obviously, doesn't matter. Fine.
- Then I open the details for http 500 exceptions to check it out, only to find that the controller is showing me three URLs with 1 exception, and one URL with 266 exceptions; that is 269 exceptions in total which is faaar awaay from 1115. Not fine at all.
- Not only that, but when we look at the diagram on the same details page (see attached picture), we can see that indeed there were around 1.1k counts (roughly 532 times 2 = 1064, and plus few of other data point counts... you get 1115 just fine), but it is extremely different than 269!?
I was not lazy and did the same math for other non-http exceptions and the summary page count was always giving the same result as the one on the diagram. Not only that, but when I analyzed other http errors (401 and 404) which were counted in single digits, the number always matched - unlike for the error 500.
Anybody has any idea what is going on? This is an obvious difference and it gives me fear that in some cases appdynamics is not giving proper results - which is not acceptable for the premier monitoring solution after all. Please help!
- Mark as New
- Bookmark
- Subscribe
- Mute
- Subscribe to RSS Feed
- Permalink
- Report Inappropriate Content
03-04-2021 09:57 AM
Hi @Anonymous,
I think for this, it would be best to contact support, which you can do here.
Please do share any learnings you get from support as a reply to this post. Knowledge sharing is what drives this community forward.
Thanks,
Ryan, Cisco AppDynamics Community Manager
Found something helpful? Click the Accept as Solution button to help others find answers faster.
Liked something? Click the Thumbs Up button.
Check out Observabiity in Action
new deep dive videos weekly in the Knowledge Base.
Learn how Splunk and AppDynamics are redefining observability
Register Now!
Dive into our Community Blog for the Latest Insights and Updates!
Read the blog here

Thank you! Your submission has been received!
Thank you! Your submission has been received!
Oops! Something went wrong while submitting the form
