Using AppDynamics Dashboards for insight into Hybris environments
The default views and dashboards provided by AppDynamics give an extensive insight into the SAP Hybris environment.
The following dashboards will help users understand the specific behavior of SAP Hybris and also will add business performance metrics, giving real-time business insights.
Table of Contents
JMX dashboards
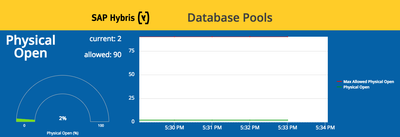
Database Pools

See file below: CustomDashboard_SAP+Hybris+-+Database+Pool_1477493960662.json
|
The Database Pools Dashboard will help you to easily spot issues related to database pooling.
|
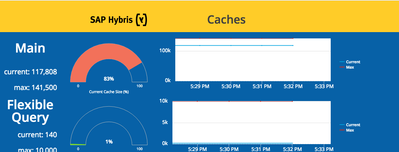
Caches

See file below: CustomDashboard_SAP+Hybris+-+Caches_1477493987210.json
(70 KB)
|
View all cache-related metrics on a single dashboard.
|
Business dashboards
Business iQ Dashboard

See file below: CustomDashboard_SAP+Hybris+-+Continous+Integration+-+Business+Impact_1481109941846.json
(343 KB)
|
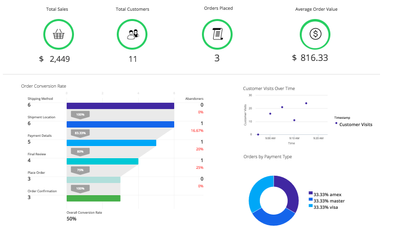
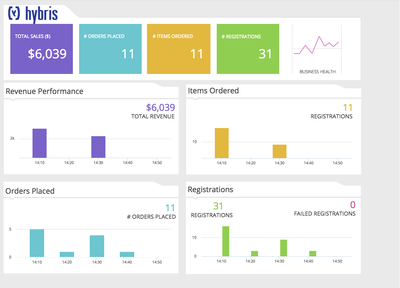
The Business iQ Dashboard provides business visibility without making code changes within the Hybris installation.
Example widgets extract data such as total sales, customer counts, order counts, average order value.
One can also analyze the credit card usage along with the conversation rate funnel—all without any changes to the existing Hybris implementation.
|
CI Pipeline - Business Impact

See file below: hybrisBusinessIQDashboard.json
(45 KB)
|
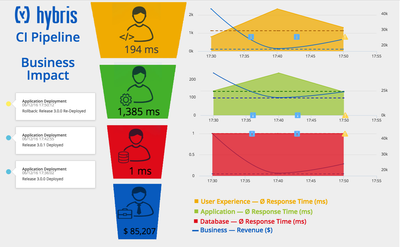
The CI Pipeline - Business Dashboard helps to understand the impact on the revenue by releases through a continuous integration process.
KPIs for the frontend, middleware, and backend help to understand in which the main component the root cause occurs.
|
Leadership Dashboard

|
The Leadership Dashboard displays key performance indicators for the business unit side by side. Data is collected and displayed and real-time and will help to spot deviations easily.
|
User Journey Dashboard

|
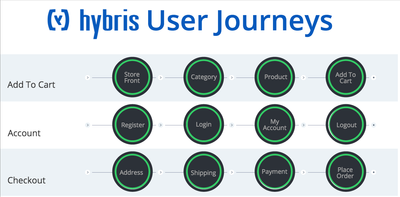
The User Journey Dashboard will help you to understand which critical steps of the important user journeys of your e-commerce platform are not working properly.
To use this dashboard, you need to add a health rule for every critical business transaction. The default health rules are called "BTName Performance Is Problematic", e.g.,
- Store Front Performance Is Problematic
- Register Performance Is Problematic
- Place Order Performance Is Problematic
|
Tier dashboards
The following Load Balancing Dashboard can be associated with tiers within the SAP Hybris application.
See Associate a Custom Dashboard Template with a Tier or Node and follow the instructions there to associate this dashboard with your tiers.
Load Balancing Dashboard

See file below: CustomDashboard_Load+Balancing_1481299566031.json (26 KB)
|
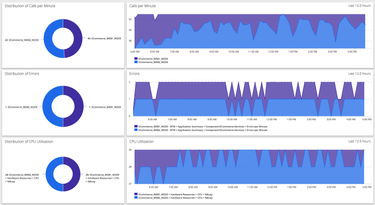
The Load Balancing Dashboard will help you to spot issues with the balancing of load among your cluster nodes.
|
