- Community Hub
- Forum Q&A
- Business iQ (Analytics)
- Cisco Cloud Observability
- Controller (SaaS, On Premise)
- Dashboards
- Dynamic Languages (Node.JS, Python, PHP, C/C++, Webserver Agent)
- End User Monitoring (EUM)
- Infrastructure (Server, Network, Database)
- Java (Java Agent, Installation, JVM, and Controller Installation)
- Licensing (including Trial)
- .NET (Agent, Installation)
- Privacy and Security
- Smart Agent
- General Discussions
- Resources
- Groups
- Idea Exchange
Click the Start a free trial link to start a 30-day SaaS trial of our product and join our community as a trial customer. If you are an existing customer do not start a free trial.
AppDynamics customers and established members should click the sign in button to authenticate.
- Cisco AppDynamics Community
- Resources
- Knowledge Base
- Exposing an MBean as a JMX Metric
- Subscribe to RSS Feed
- Mark as New
- Mark as Read
- Bookmark
- Subscribe
- Printer Friendly Page
- Report Inappropriate Content
- Article History
- Subscribe to RSS Feed
- Mark as New
- Mark as Read
- Bookmark
- Subscribe
- Printer Friendly Page
- Report Inappropriate Content
on 02-19-2015 03:12 PM - edited on 11-19-2018 07:37 AM by Nina.Wolinsky
Default JMX Metrics Example
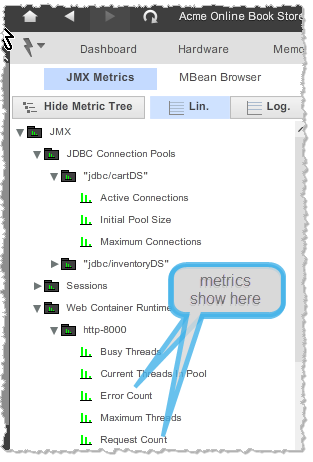
Some MBeans exposed by various supported application servers are preconfigued as JMX Metrics that can be viewed in the JMX Metrics Browser.
In this screen capture of the JMX Metrics Browser, under Web Container Runtime, you can see the two metrics "Error Count" and "Request Count".
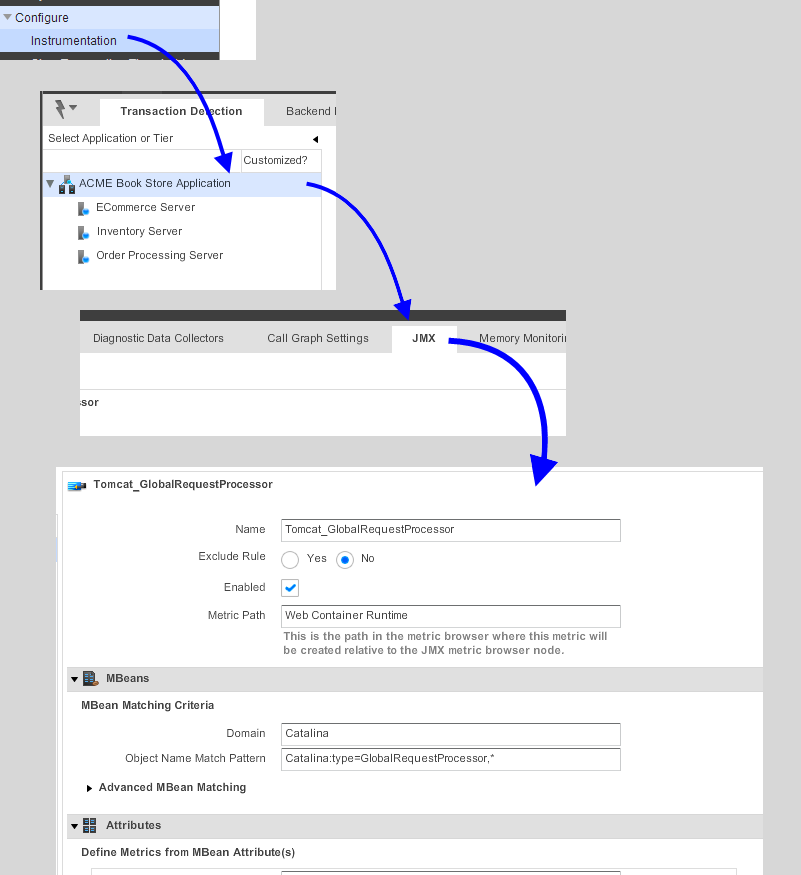
Where did these come from? These metrics were configured from MBeans exposed by the Tomcat web container. To see the configuration for these metrics, do the following:
1. Select Configure -> Instrumentation.
2. Select the application.
3. Select the JMX tab.
In this "metric rule" named Tomcat_GlobalRequestProcessor", you can see where the Metric Path and the MBean matching criteria in the domain "Catalina" have been specified. This path in the metric browser was seen in the first screen capture.
The next screen capture shows the two attributes of this MBean.

Thank you! Your submission has been received!
Thank you! Your submission has been received!
Oops! Something went wrong while submitting the form


