Hello,
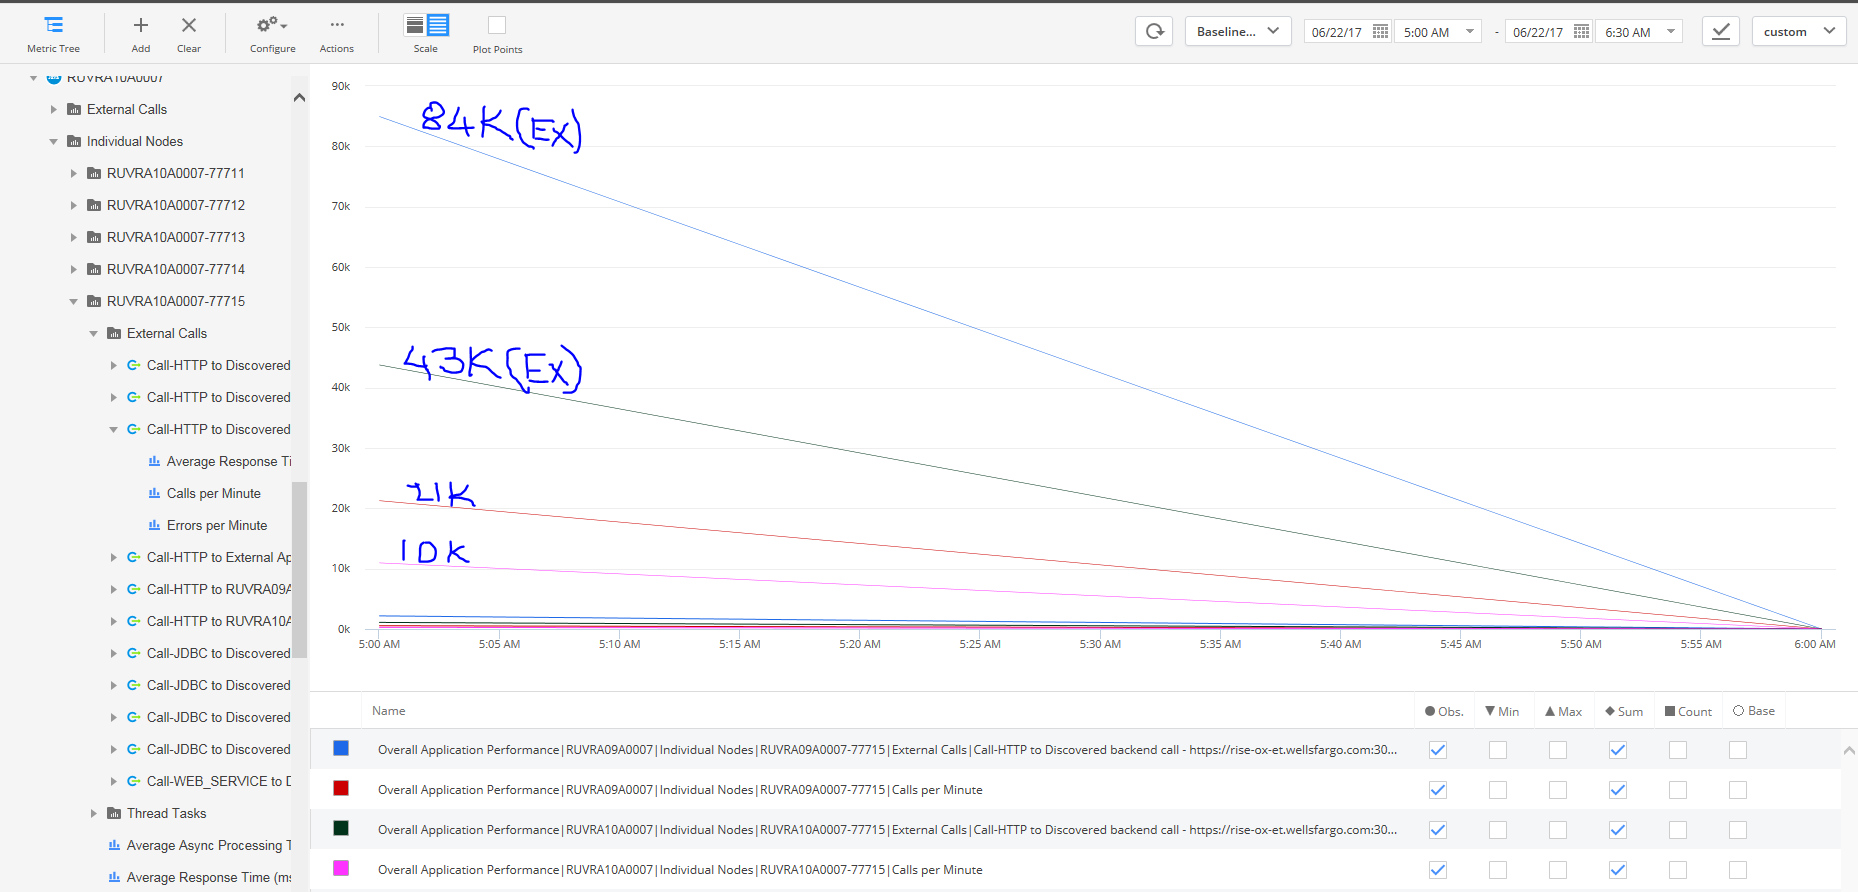
There was a Load test in the last week, There are 4 lines in the attached graph, two from each of 2 different JVMs. One line of each pair is incoming requests and the other is outgoing requests to RISE, an internal DataPower installation. They should be in about a 1:1 ratio. According to Tomcat’s access log, there were about 900-1100 incoming calls per minute on each server, which is what I expect based on the load we were throwing at it. In addition, the DataPower guy said he saw 60k total requests, which sounds about right (2 servers @1000 requests per minute * about 30 minutes.)
However the numbers in AppD are pretty different. The incoming calls per minute are too low and the outbound (to DataPower) calls are too high. At first this caused the developers quite a bit of consternation because they couldn’t understand why there were so many backend calls. However we think the AppD numbers are incorrect. Can anyone let me know the root cause for this?
Please see the attached metric browser screenshot for reference and any responses are highly appreciated.
Thank you,
Santhosh.